
Weather & Forecast Models Graphics
Forecasts for Nearly Every US and Canadian Wind Farm, Every HourCurrent and Forecast Graphics
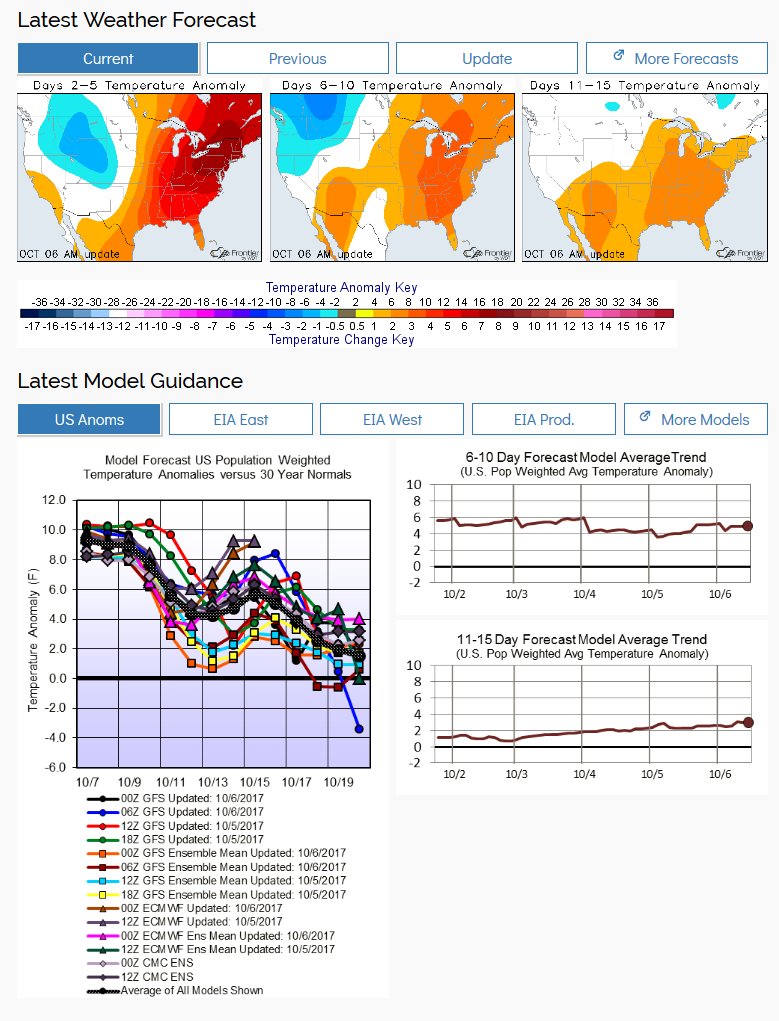
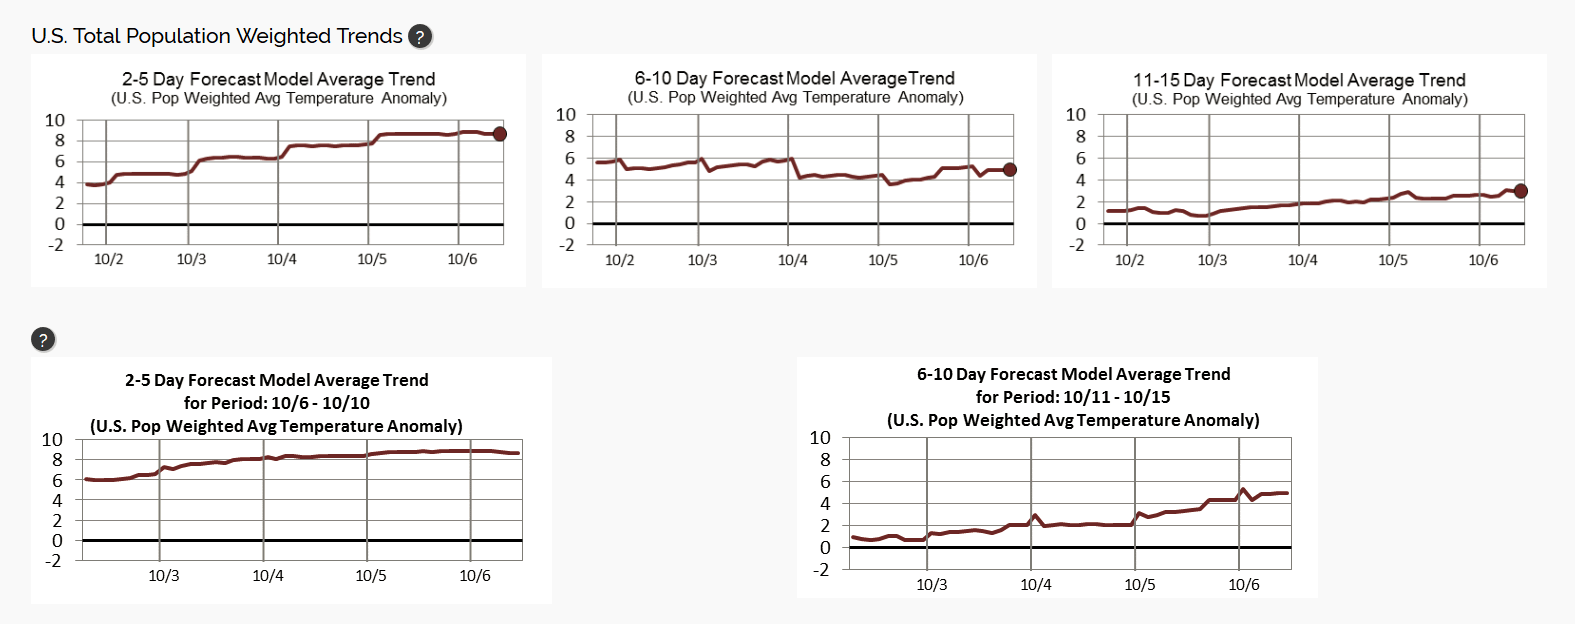
Frontier Weather offers a variety of weather graphics depicting current weather conditions, including temperatures, humidity, windspeed, radar, satellite, etc. Forecast graphics include temperatures, temperature anomalies, precipitation, snowfall, wind, hurricane track forecasts among others. Most of our forecast model temperature anomaly maps update in real time as model data becomes available, with other graphics updating once the model run is complete. Forecast graphics generated from our own forecast processes are updated twice per day on business days (early morning and midday), and once on Sunday.
Model Graphs, Maps and Data
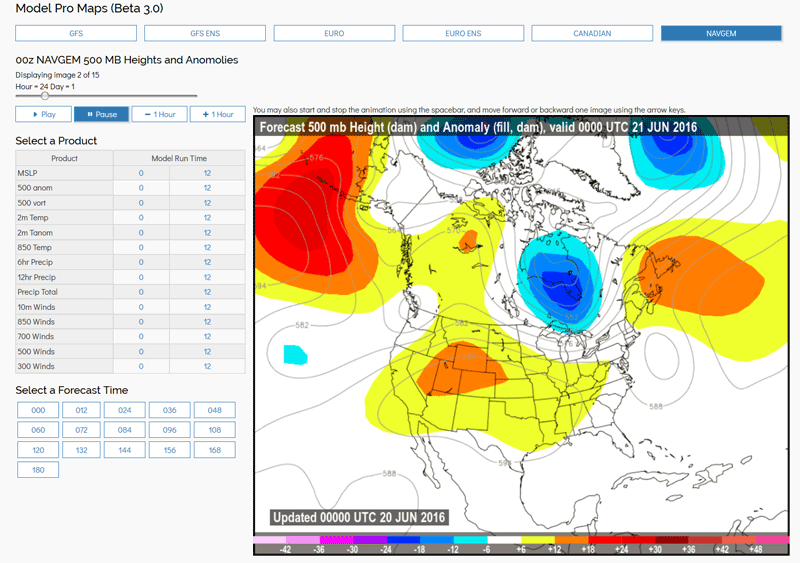
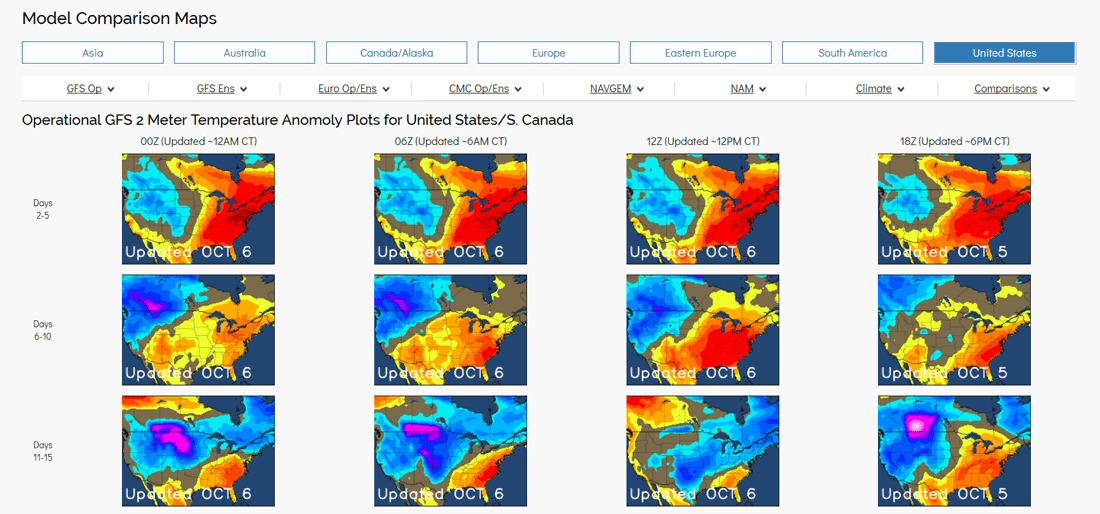
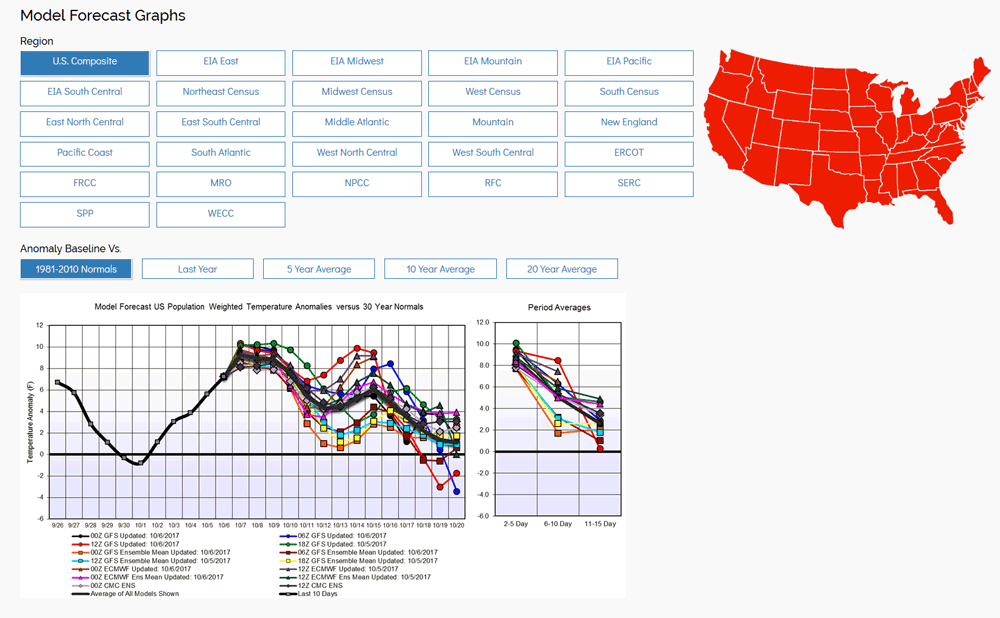
Frontier Weather subscribers have access to both graphical and tabular model data. A sample of the type of model forecast graphs we have available is shown below using temperature anomalies, but we also have forecast maps available for other parameters such as precipitation, precipitation anomalies, snowfall, high and low temperatures, and others. We currently produce forecast maps for the GFS operational and ensemble models, the CMC operational and ensembles, the ECMWF operational and ensembles (out to 15 days for the ECMWF ensembles) as well as the NAM and NAVGEM. Most forecast parameters are available for various regions including the US, Canada and Alaska, Europe, Asia, South America and Australia.
To see what types of model data files are available, go to the model data page here and view a full listing. Note that you will not be able to access any of the data files without a subscription.