City Specific Historical and Forecast Daily Data
Historical/Forecast Crop Weighted Weather Data
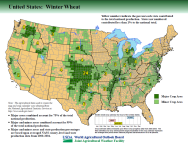
Crop weighted weather data files essentially use a rough area weighting to determine the values. Weightings are based on the USDA crop maps (example) with the major crop growing counties weighted 75% and the minor crop growing counties weighted 25%. All major crop growing counties were weighted equal, as were all minor crop growing counties in order to keep the weightings constant over time. The same 230 observation sites used to generate the energy weighted degree day files were used to generate these crop weighted data files. While a large number of observation sites are used, shower and thunderstorm activity can create widely varying rainfall totals over a small area, and so the daily rainfall values in the data files may over or under estimate the true average rainfall seen across a given region on a given day depending on the distribution of rainfall in relation to the observation points. These differences usually balance out over the course of a season.
20 Year averages are a rolling 20 year average based on a July-June water year for the period ending with the most recently completed June. Since our data set begins in July 1996, the current "20 year average" is actually only 18 years presently, but will be 20 years in 2017. Our dataset only extends back to 1996 at the present time since some of the observation sites in our database used in the analysis don't extend back prior to 1996.
| Date Range | Corn | Cotton | Oranges-FL | Oranges-CA | Rice | Soybeans | Spring Wheat | Winter Wheat |
| 7/1/1996 through 15 Day Forecast | .csv | .csv | .csv | .csv | .csv | .csv | .csv | .csv |
| 20 Year Average | .csv | .csv | .csv | .csv | .csv | .csv | .csv | .csv |