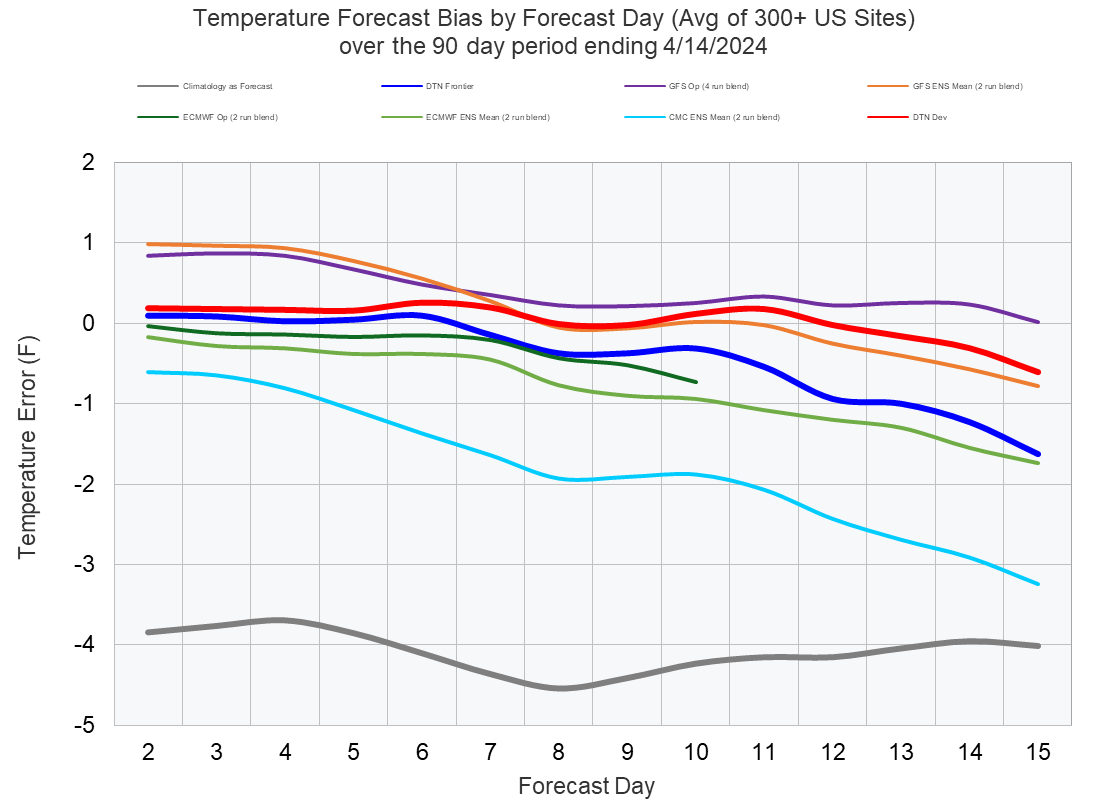
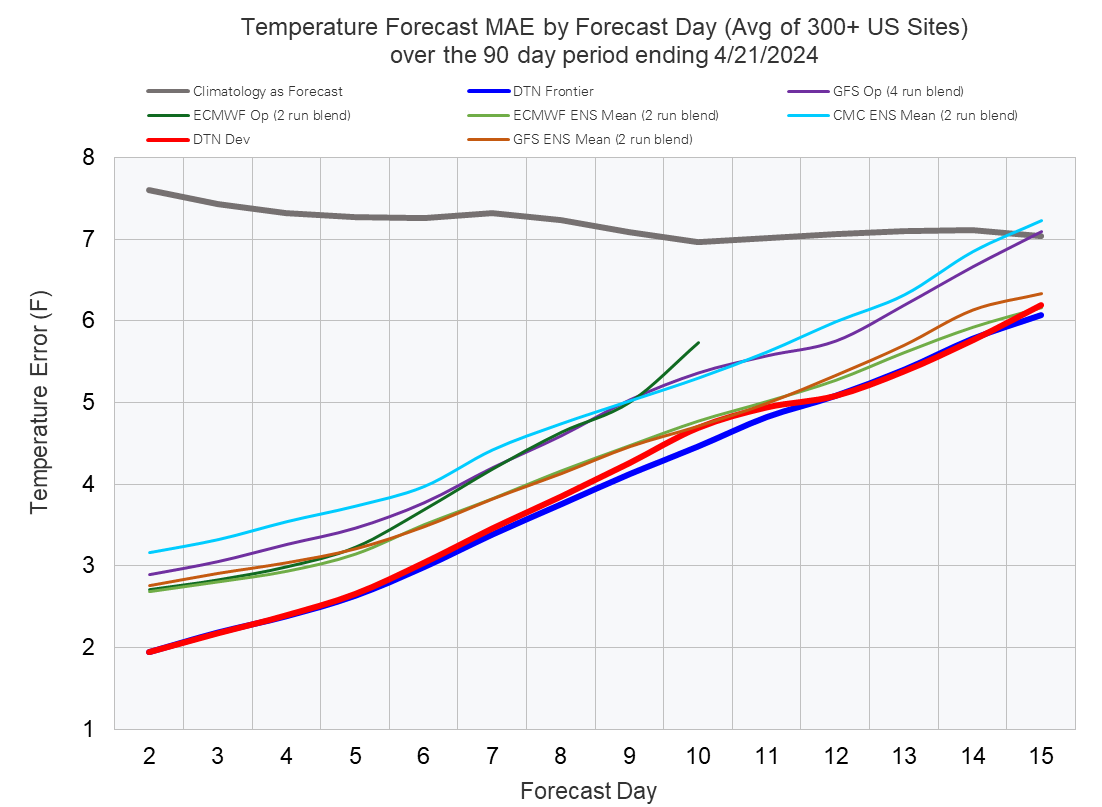
Forecast Verification Summary-Average Bias and Mean Absolute Error (MAE) for the Last 90 Days
Notes on the Verification Data
You can click on any image or graph to view a larger version. Values in the above tables and in the maps below are for the average of the individual forecast days within each period, not for the period average itself. The mean absolute errors for the period averages will always be smaller than for the average of the individual days within a given period. Climatology represents the forecast error of a forecast made using 1981-2010 climate normals as a forecast. The Climatology bias also roughly approximates the average US temperature anomaly over the last 90 days but of the opposite sign. A climatology bias of -3.7 would indicate that temperatures averaged 3.7°F above normal for that given period. Note that forecasts included in the verification period are those that were valid during the 90-day period, so some forecasts were made prior to the start of the 90-day period, however, only the portion of those forecasts that fell within the 90-day period is included. Verification data is only tabulated for days when Frontier Weather forecasts are produced. All model forecasts are calculated based on the 2-meter temperature forecasts from each respective model, and verification data provided here is for daily average values (average of the forecast daily high and low temperature). Daily high and low temperatures from each model are calculated based on the 6Z to 6Z time period, which is equal to midnight to midnight CST.
Forecast Bias Summary (°F)
| Model |
|
|
|
|---|---|---|---|
| DTN-Dev | |||
| ECMWF | |||
| ECMWF ENS | |||
| GFS | |||
| GFS ENS | |||
| CMC ENS | |||
| Climatology | |||
| DTN-Frontier |
Forecast Mean Absolute Error (°F)
| Model |
|
|
|
|---|---|---|---|
| DTN-Dev | |||
| ECMWF | |||
| ECMWF ENS | |||
| GFS | |||
| GFS ENS | |||
| CMC ENS | |||
| Climatology | |||
| DTN-Frontier |
Forecast Ranked MAE (1=Best)
| Model |
|
|
|
|---|---|---|---|
| DTN-Dev | |||
| ECMWF | |||
| ECMWF ENS | |||
| GFS | |||
| GFS ENS | |||
| CMC ENS | |||
| Climatology | |||
| DTN-Frontier |
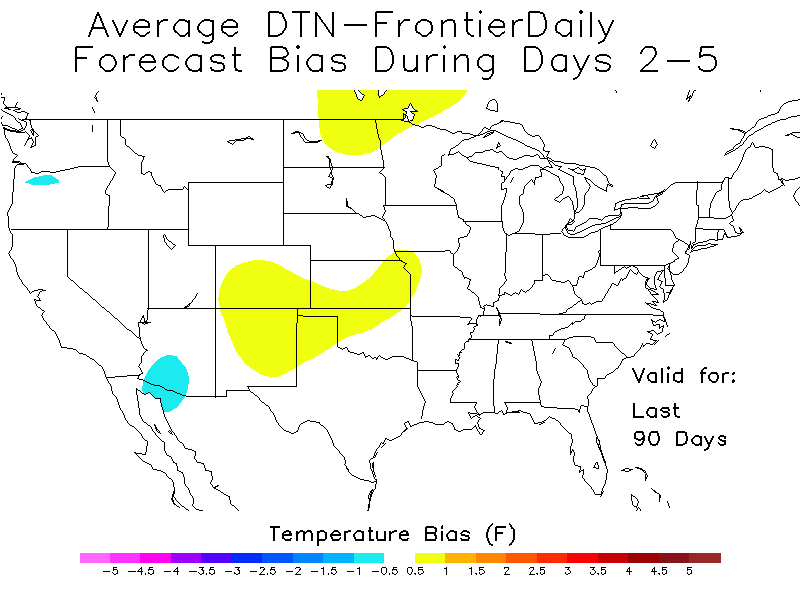
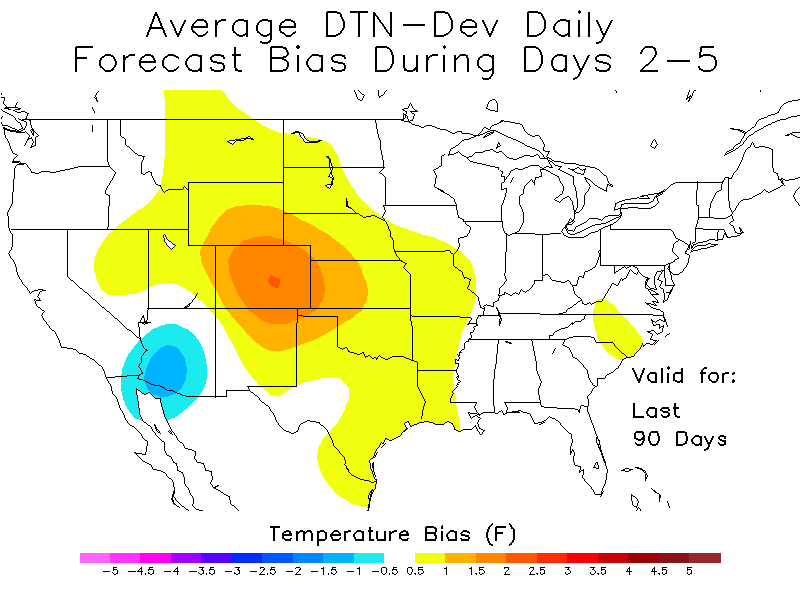
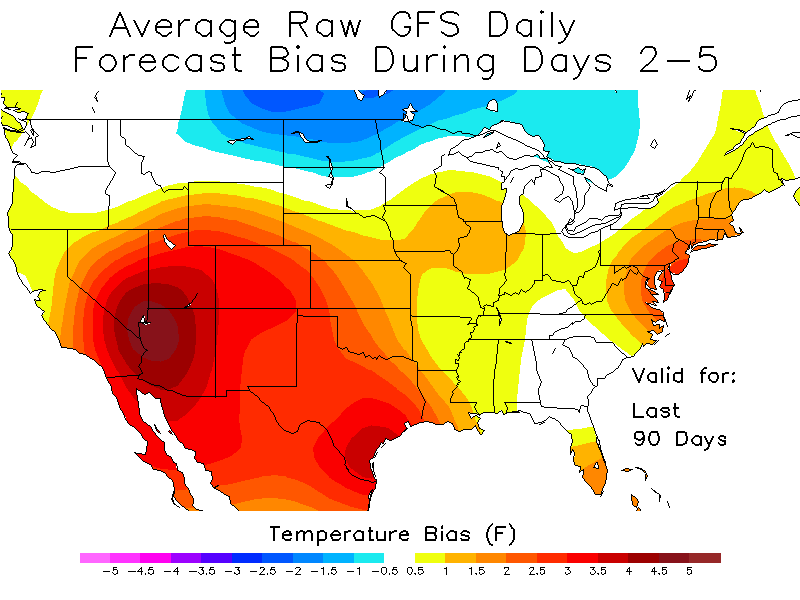
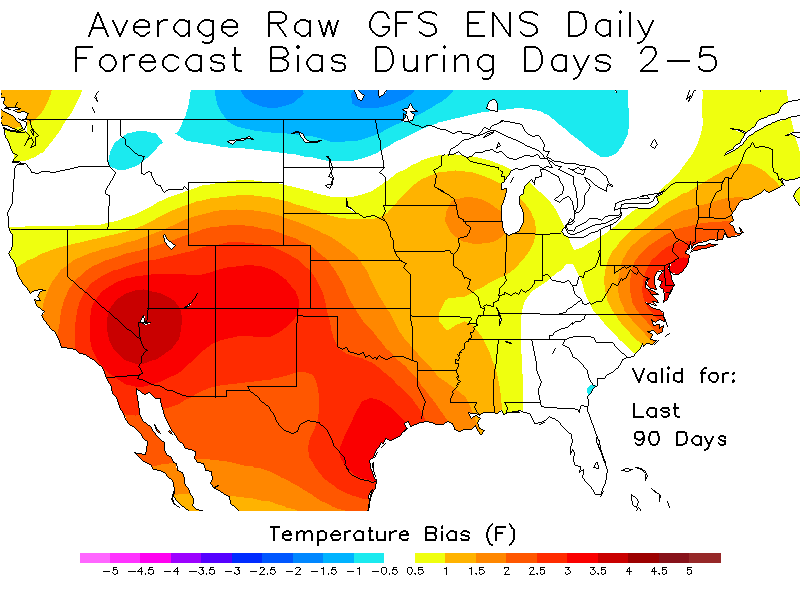
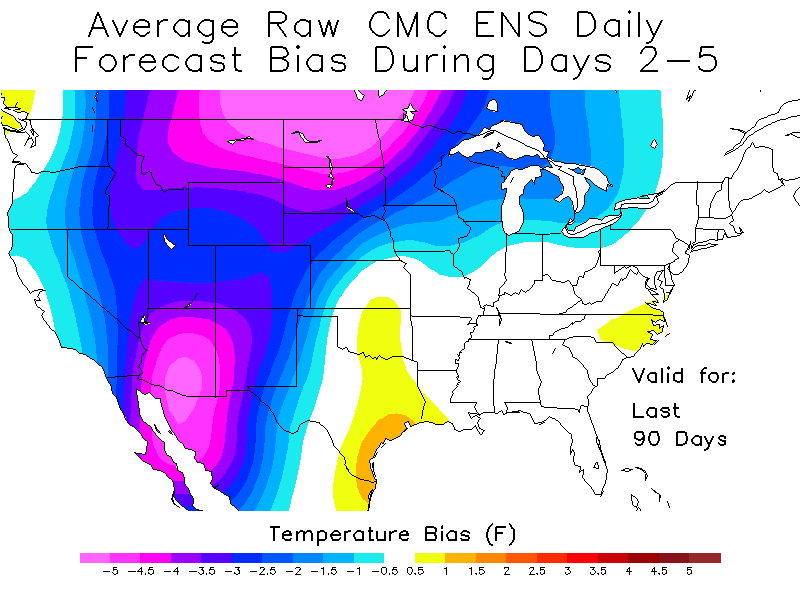
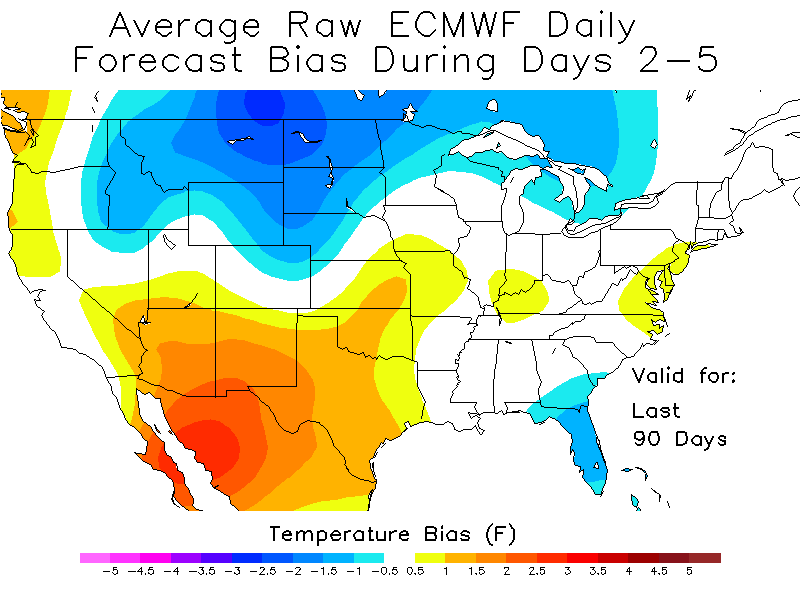
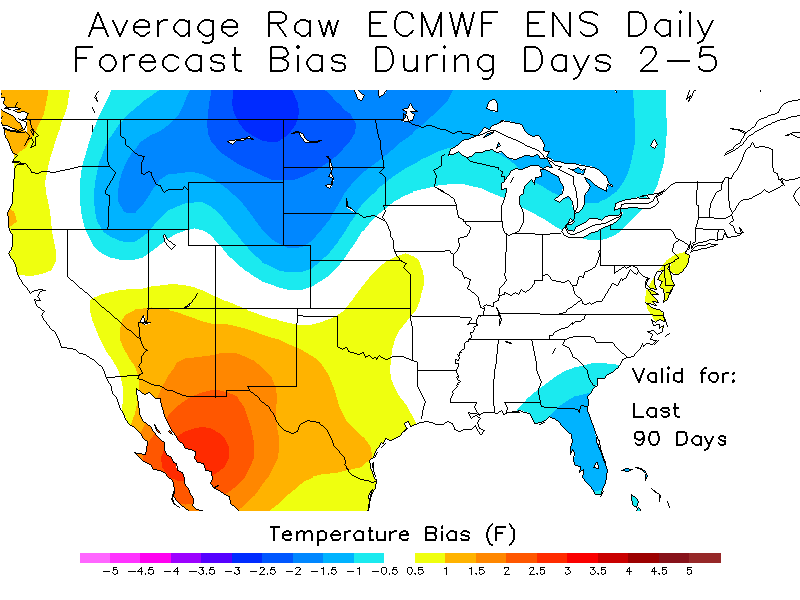
Maps of Average Daily Bias for Days 2-5 over the Last 90 Days
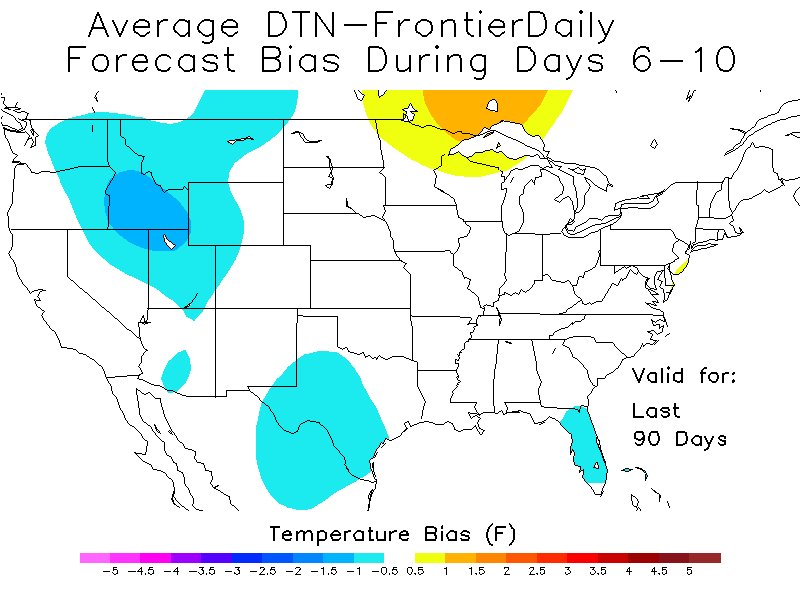
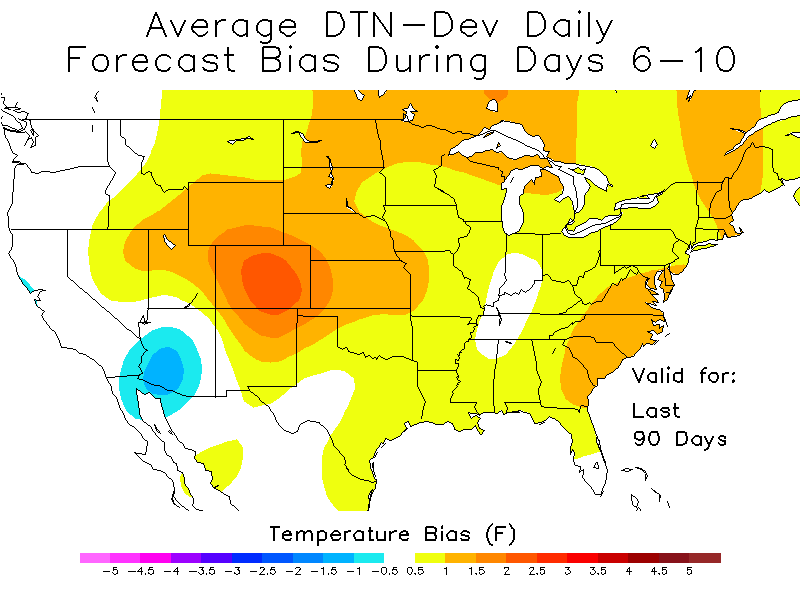
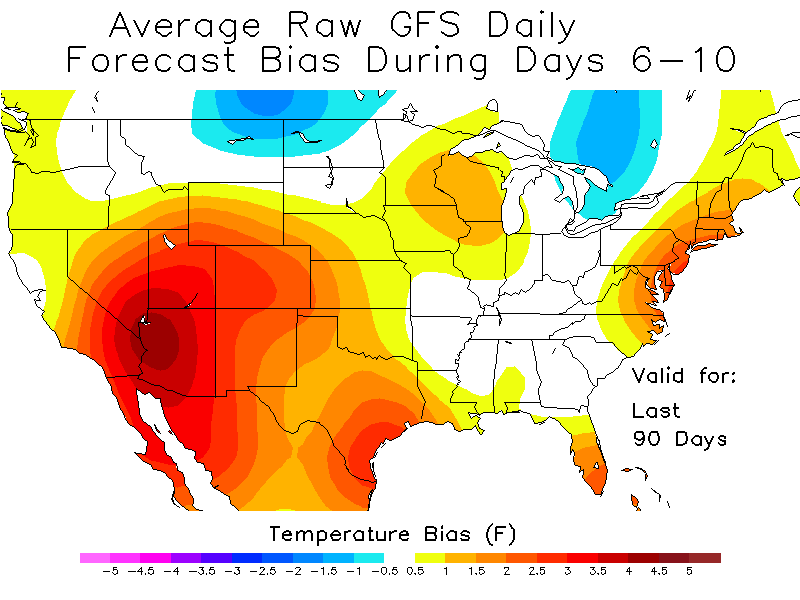
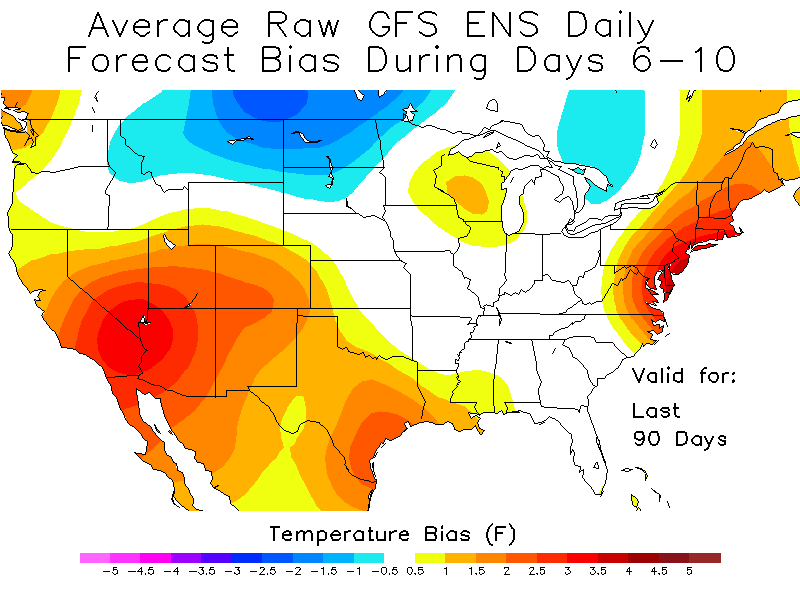
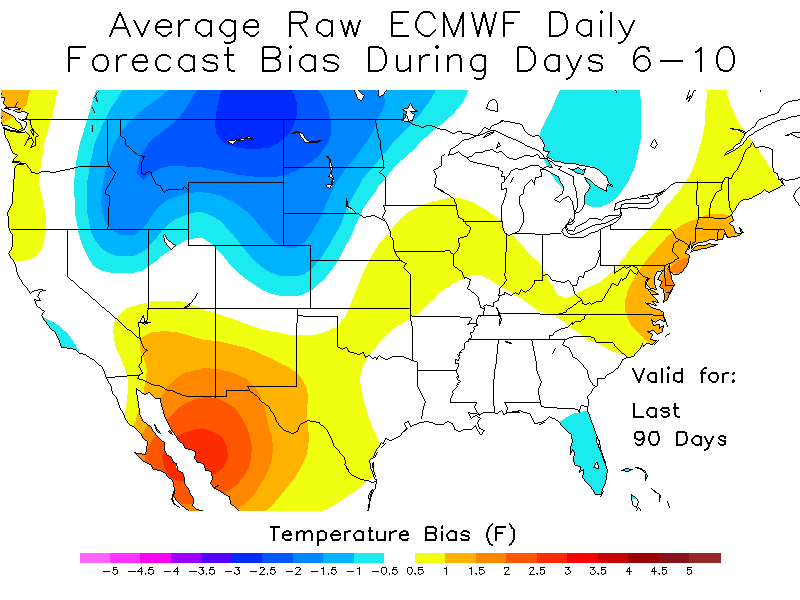
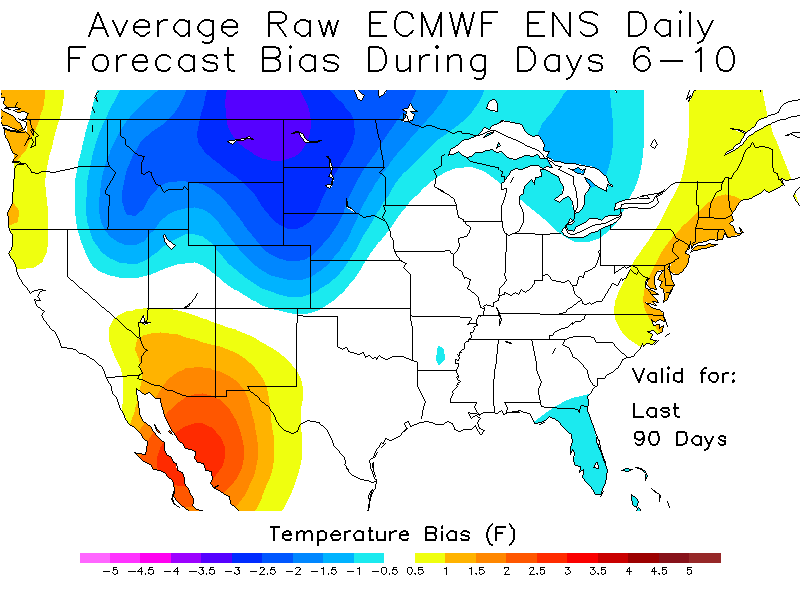
Maps of Average Daily Biases for Days 6-10 over the Last 90 Days

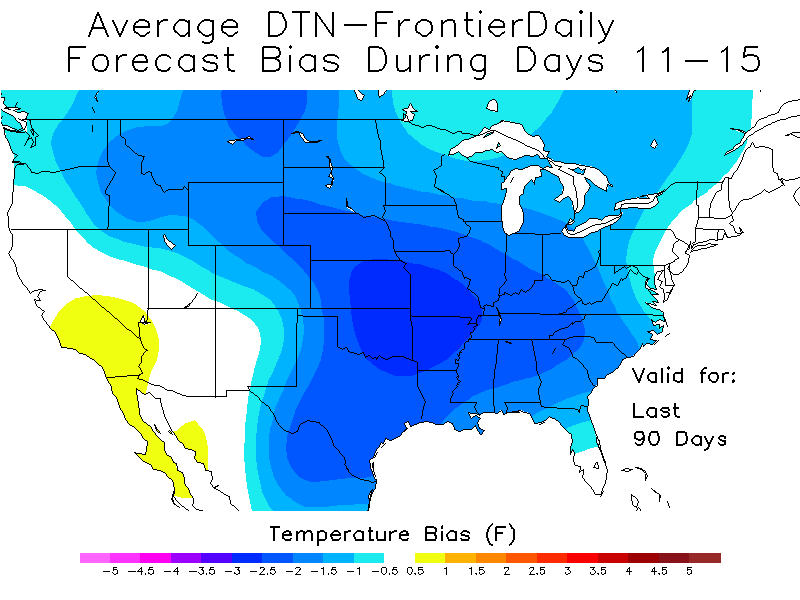
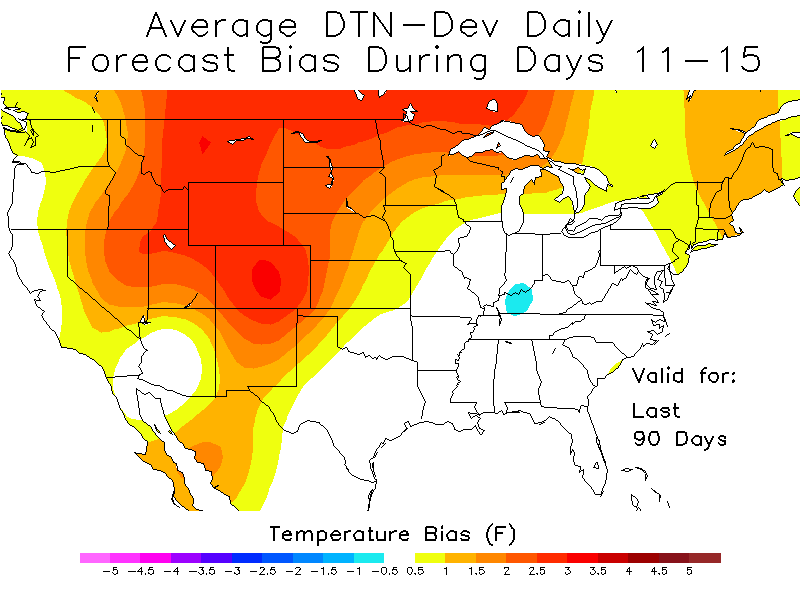
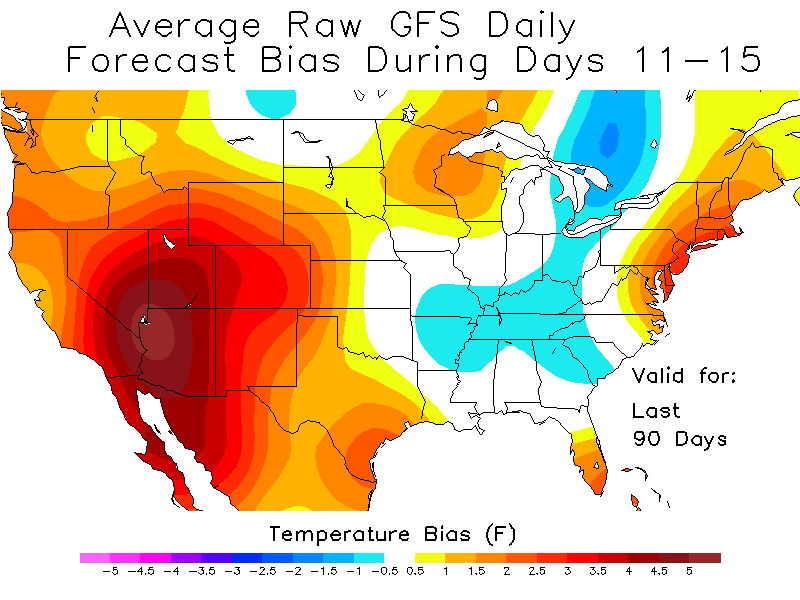
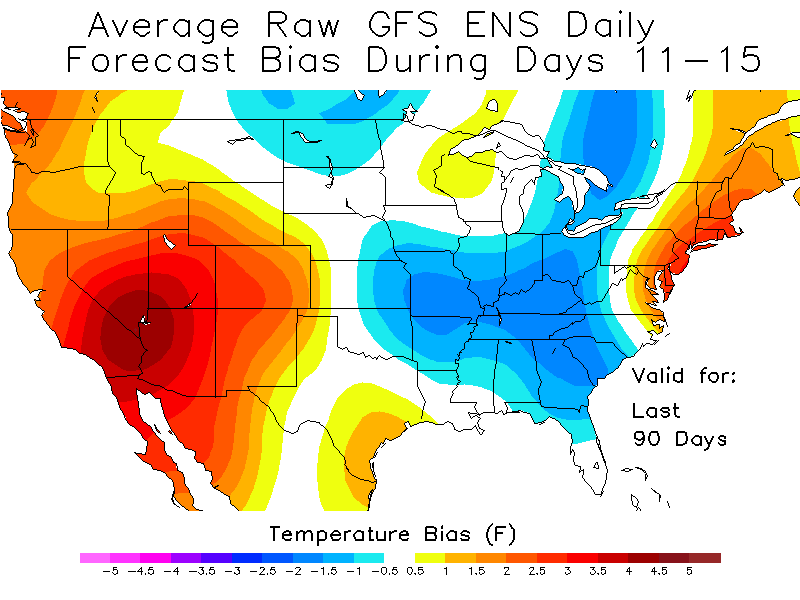
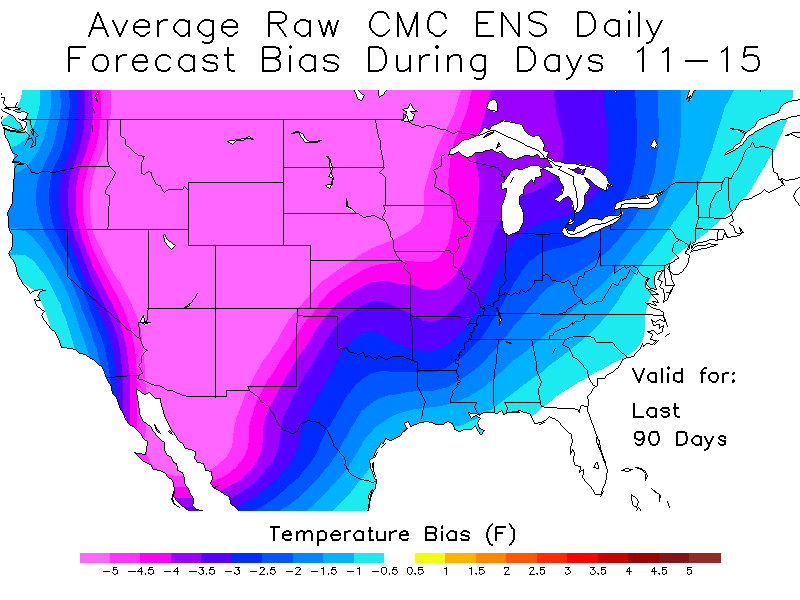
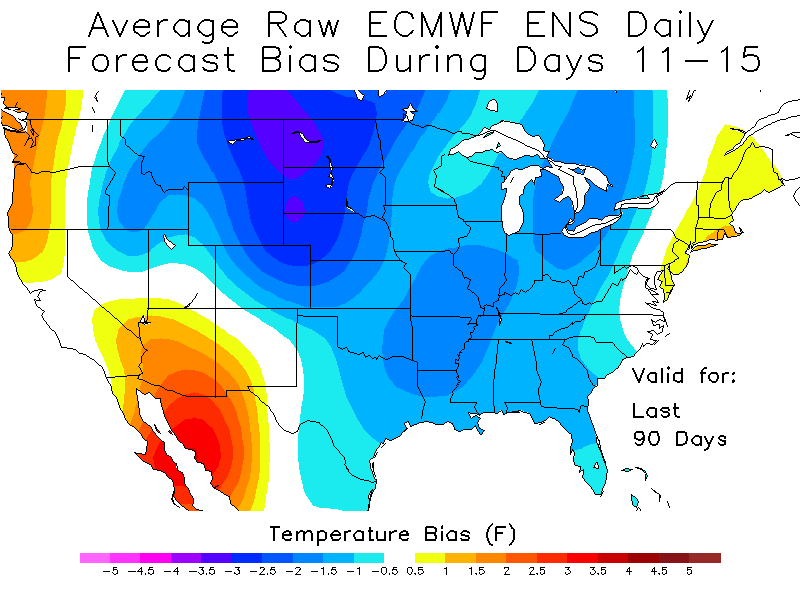
Maps of Average Daily Biases for Days 11-15 over the Last 90 Days
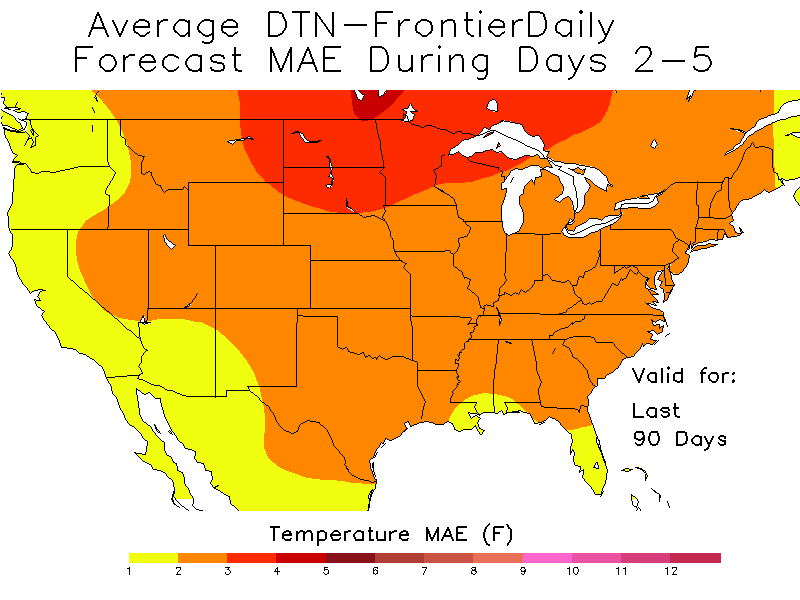
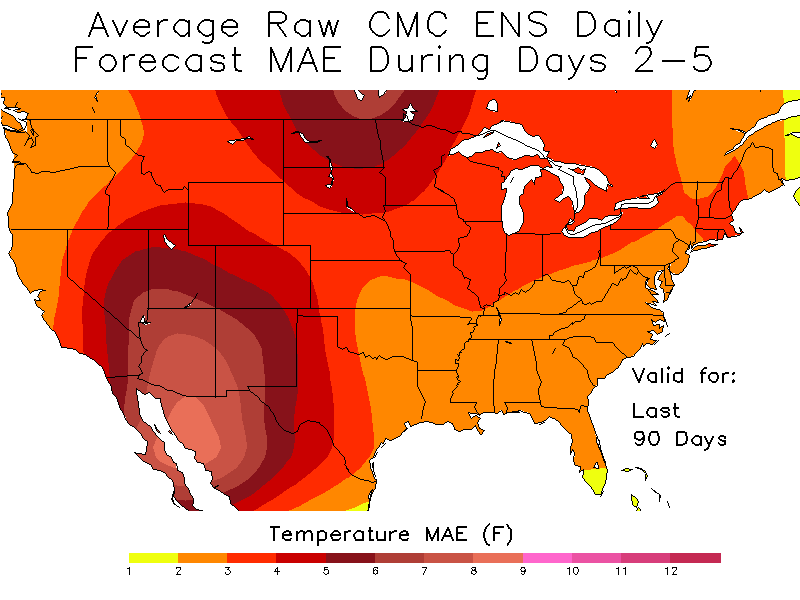
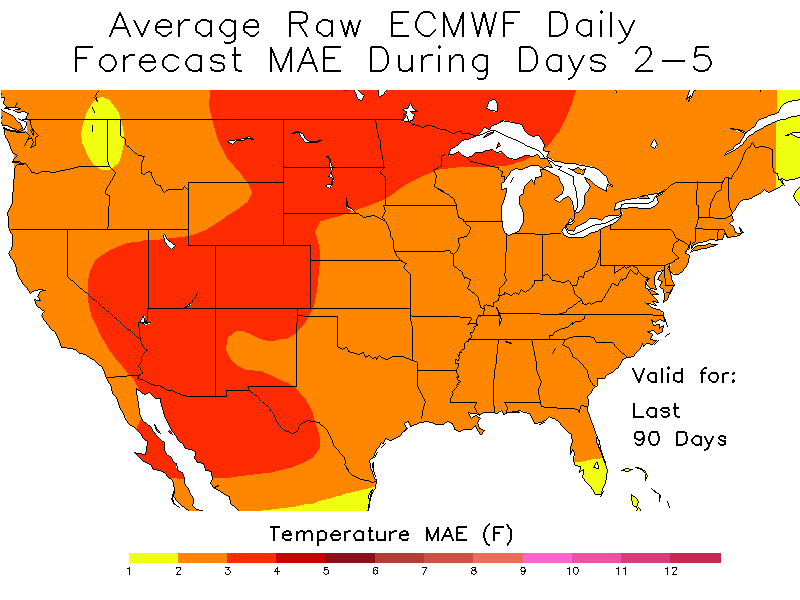
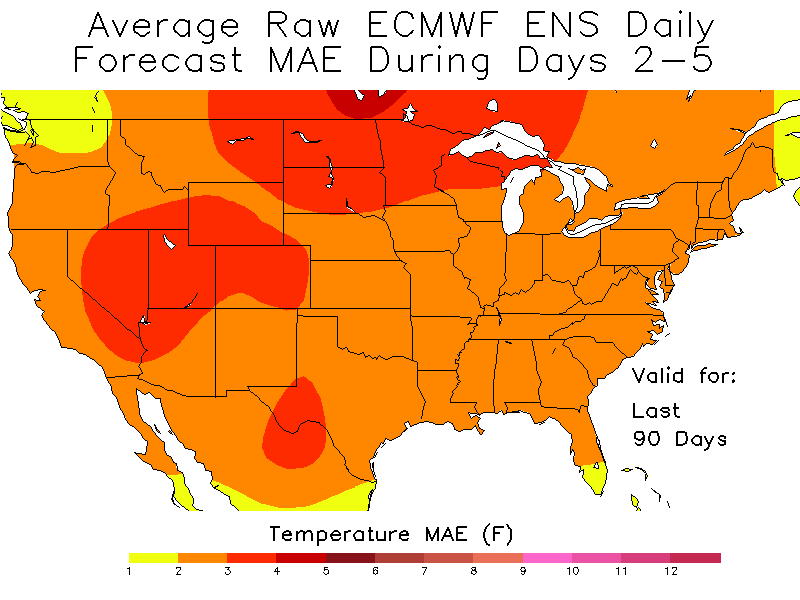
Maps of Average Daily Mean Absolute Error for Days 2-5 over the Last 90 Days


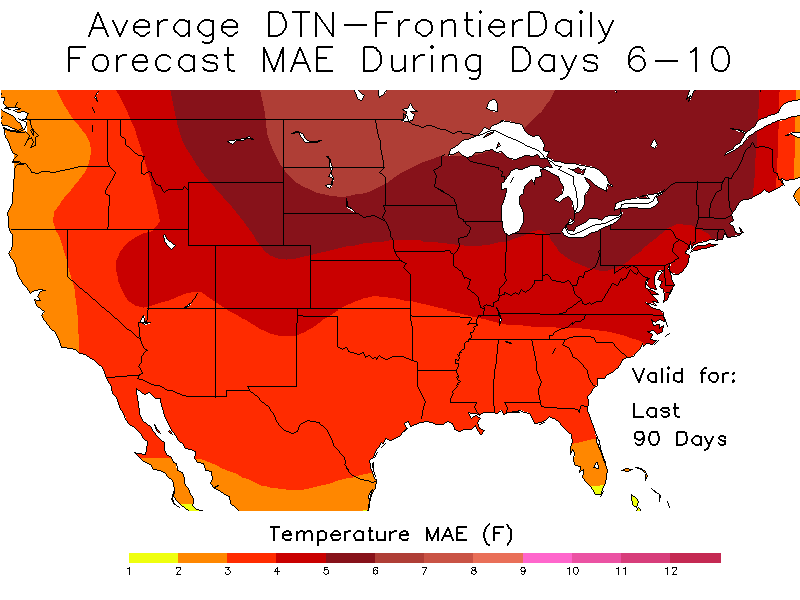
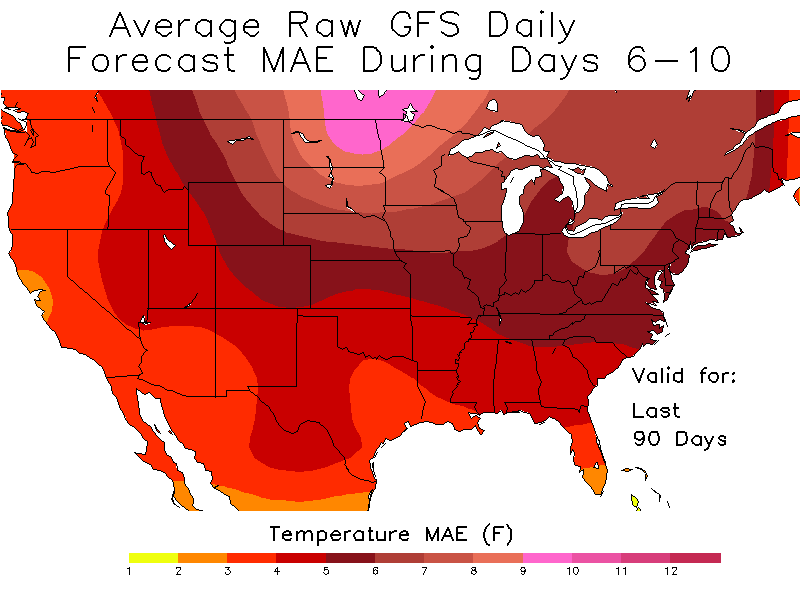
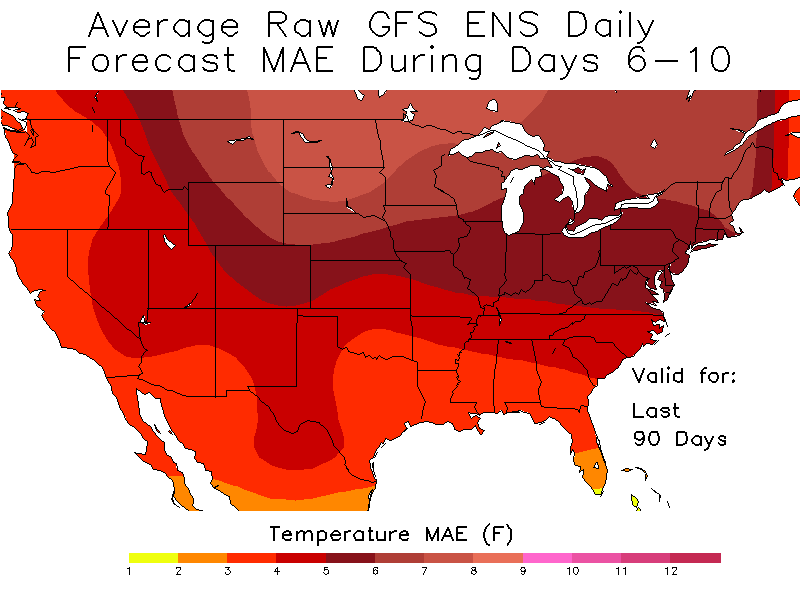
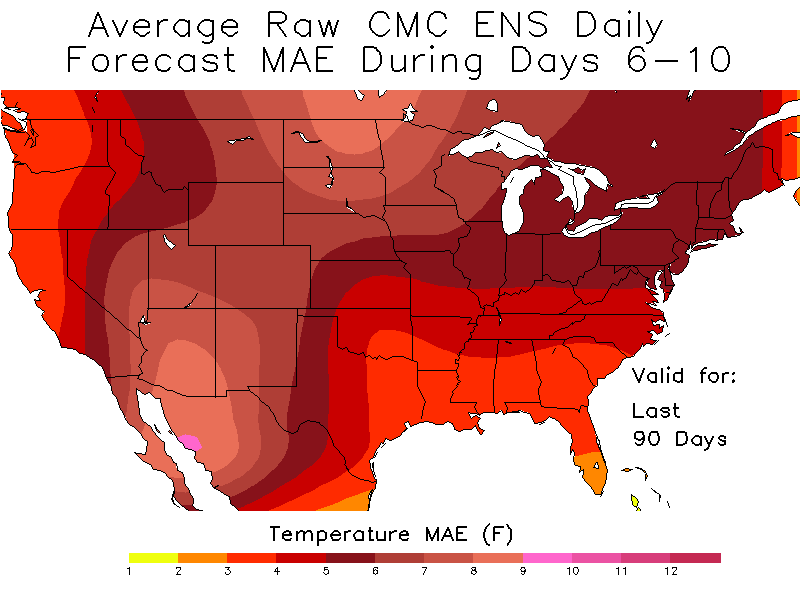
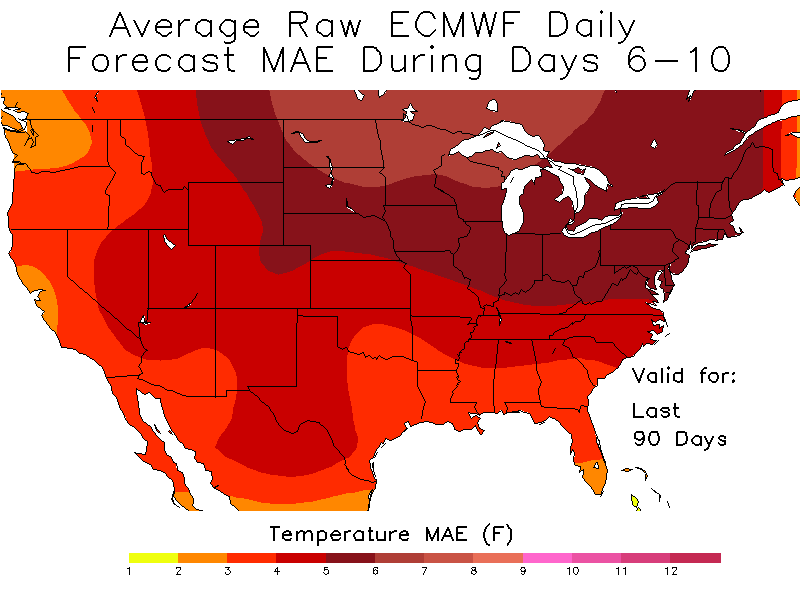
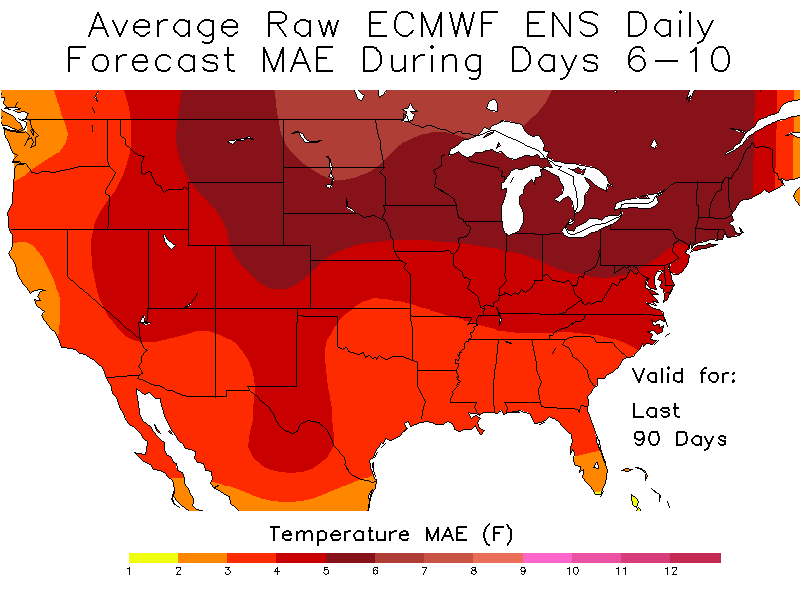
Maps of Average Daily Mean Absolute Error for Days 6-10 over the Last 90 Days
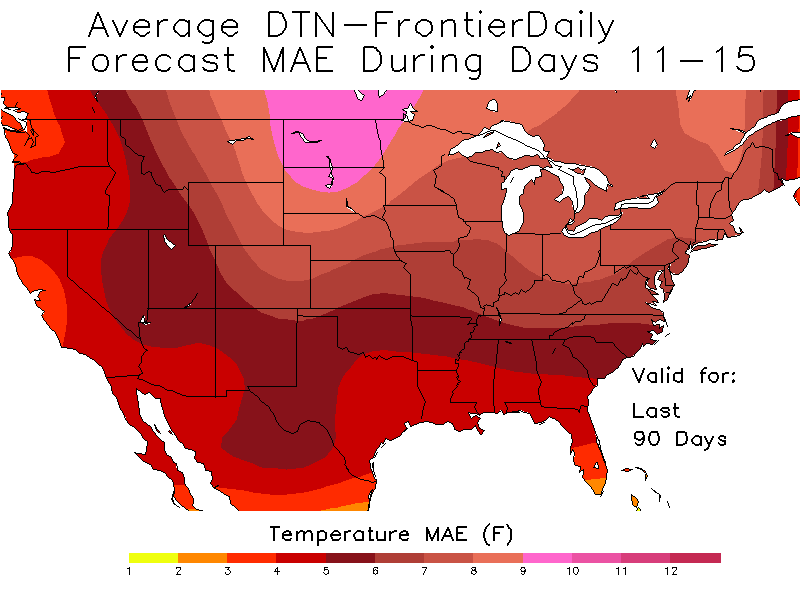
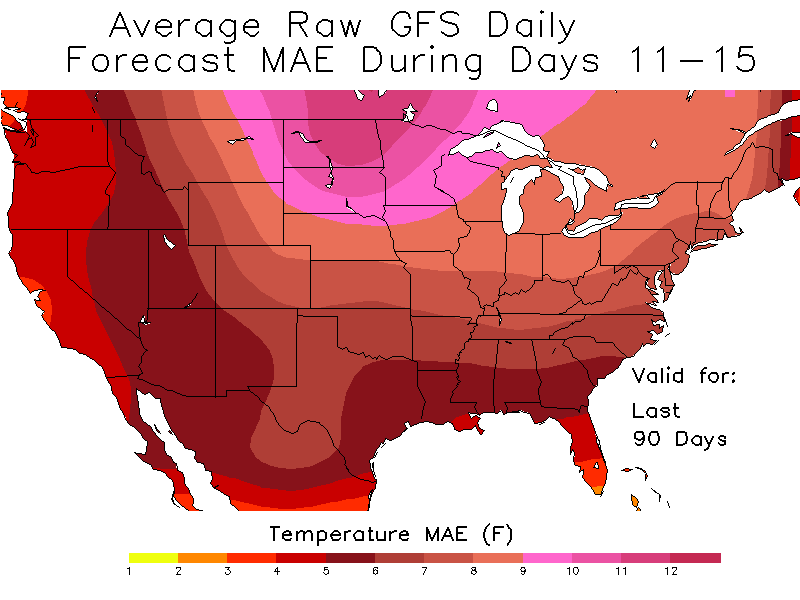
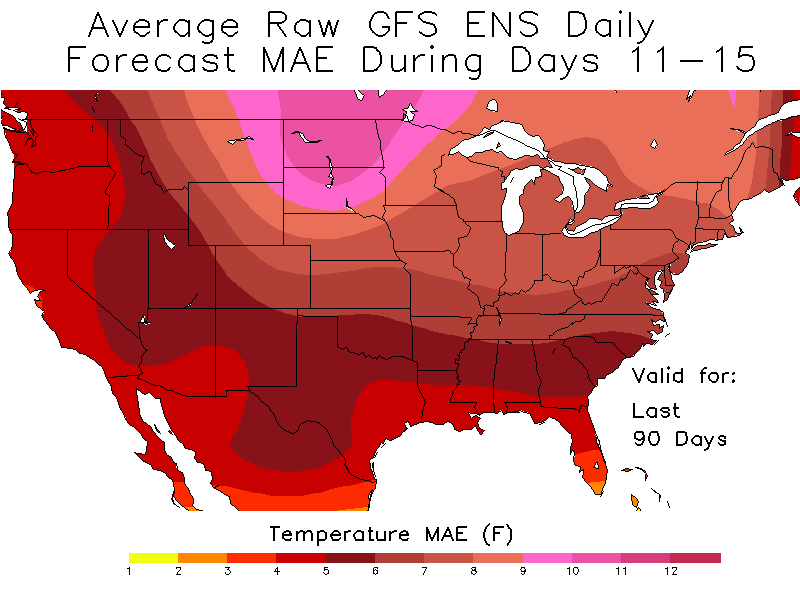
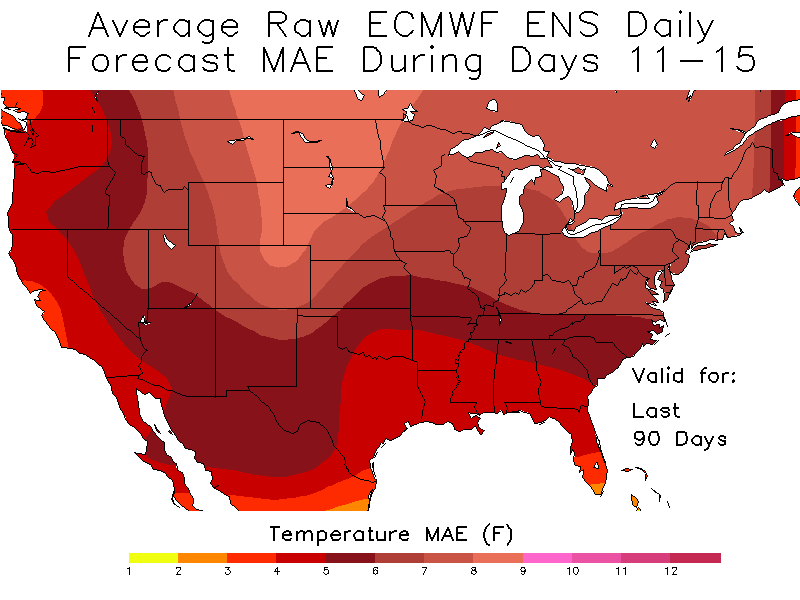
Maps of Average Daily Mean Absolute Error for Days 11-15 over the Last 90 Days